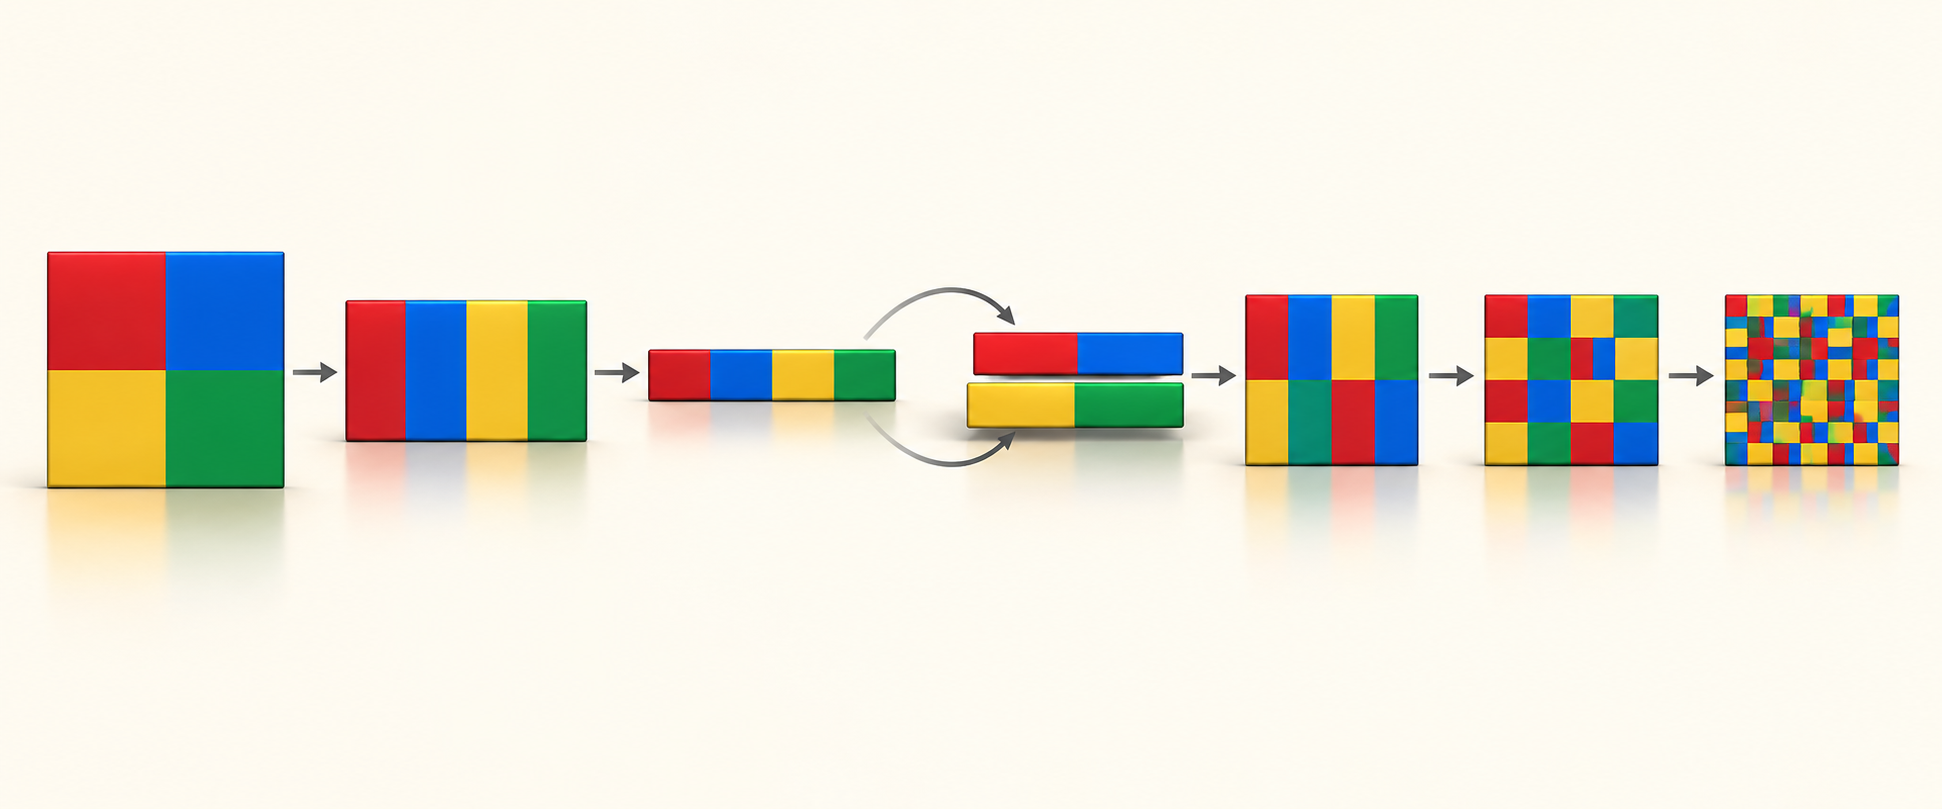
Imagine a square divided into four colors. Baker’s transformation divides it into two vertical halves, stretches each half to the original width, compresses it vertically and stacks the pieces. Repeating the action makes the colors seem increasingly mixed. In the interactive laboratory you can start with an 8×8 grid and four colored quadrants, then try larger resolutions or your own image.
The rule for a point
For coordinates 0≤x,y<1, when x<1/2 the map sends (x,y) to (2x,y/2). When x≥1/2, it sends it to (2x−1,(y+1)/2). For example (0.3,0.4)→(0.6,0.2)→(0.2,0.6)→(0.4,0.3). The second point lies in the right half, so its vertical coordinate moves to the lower band.
Area preserved, order harder to see
Each half is stretched horizontally by a factor of 2 and compressed vertically by a factor of 1/2. Their product is 1, so area is preserved. Nothing is chosen randomly: each next position follows from the previous one. Yet nearby initial points can separate quickly. This is a classic example of deterministic chaos and sensitivity to initial conditions.
The secret of binary digits
Write x=0.b₁b₂b₃… in base 2. The new horizontal coordinate is 0.b₂b₃…: the first digit is discarded from x and determines the band the point enters. This is the Bernoulli shift. In the laboratory you can click the image and follow a point orbit while viewing its leading binary digits.
A digital image differs from the continuous square
On an N×N grid there are finitely many pixels. The laboratory uses a reversible permutation: the halves widen, rows interleave and every pixel has exactly one new position. No color is lost after the initial crop and resize. Because there are finitely many states, an image must eventually recur: visual mixing is neither true randomness nor encryption.
Try it
Choose among four demo images, optionally upload a JPG, PNG or WebP, select a grid from 8×8 to 512×512 and advance the map. You can go back, use the timeline slider, compare with the original, inspect six explanatory stages, click a point and download a PNG. Your image stays in the browser. Open the Baker-map laboratory →