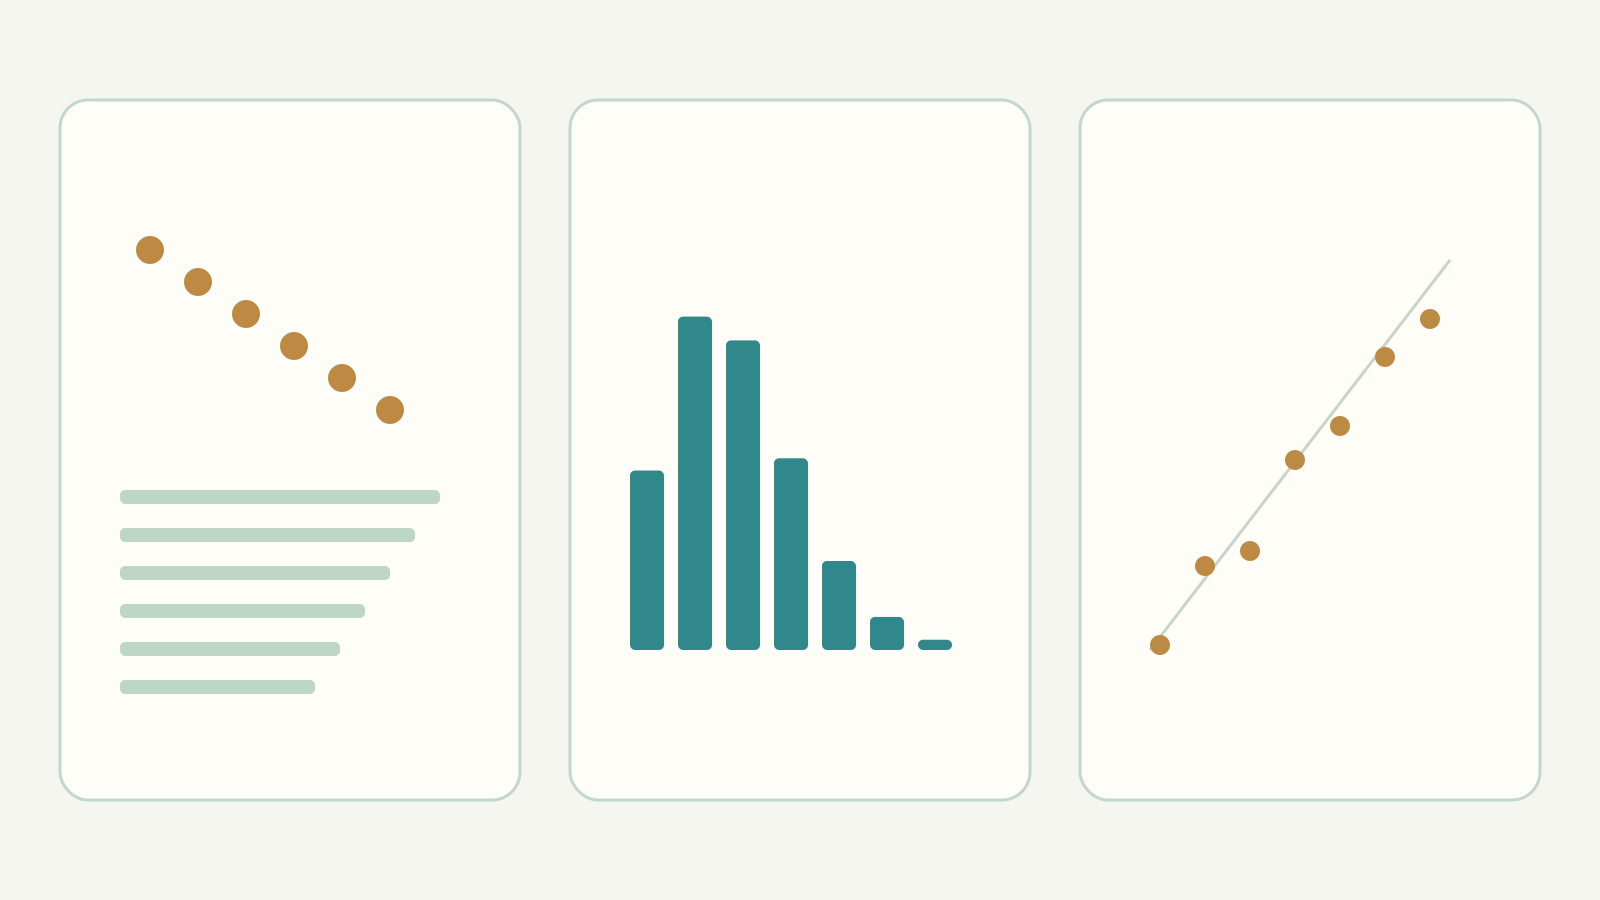
A three-stage path explaining predictions: rules and data, two worked examples, validation and improvement. Every symbol and step is explained.

What this path is for
A predictive model is a set of rules turning available data into an estimate of what might happen. It does not know the future. Our goal is to understand how a probability is obtained, repeat the calculations and identify the evidence needed before trusting it.
Football provides a concrete example, but the workflow also applies to product demand, failures and waiting times: define the question, check the data, choose a rule, calculate and validate. The appropriate formula may change; these questions remain.
The three stages, in order
Stage 1. Build a predictive model step by step
Choose data and rules. Explained means, factors and probabilities.
Stage 2. Rebuild two predictions from start to finish
Substitute numbers and read results. Two fully reconstructed calculations.
Stage 3. Validate and improve a predictive model
Measure errors and compare versions. A validation protocol, not a promise.
No programming is required. Addition, multiplication, division and percentages are enough. New symbols are defined before the formulas. Read the meaning of a step first, then its formula and finally the substituted numbers: memorising formulas is not necessary.
Three different questions
“Is the calculation correct?” asks whether the chosen rules were applied properly. “Is the prediction reliable?” requires comparisons with many observed outcomes, without future information. “Are the odds attractive according to the model?” adds a price and depends on the probability estimate. A positive answer to the first question does not answer the others.
p = 0.70 → p × 100% = 70%
70% does not promise that the next event will happen. If similar forecasts are well calibrated, many comparable cases should produce about 70 successes per 100, not necessarily exactly 70. One success or failure is insufficient to judge the model.
Available evidence and missing evidence
We reconstruct two calculation snapshots from 3 November 2026: Shakhtar Donetsk–Sporting CP and Galatasaray–VfB Stuttgart. These are frozen teaching examples, not current advice. Team history and competition aggregates allow the probabilities to be reconstructed. The full 537 competition rows and a complete archive of forecasts and subsequent outcomes are not available.
We therefore show how to validate and improve the model without claiming it is already validated. By the end you should also be able to say “this data is missing” and “this conclusion is not established”: these skills matter as much as arithmetic.
Before continuing: try it
1. Does correct arithmetic make the model reliable?
Show the explanation
No. It shows the rules were applied; reliability needs many forecasts recorded before events and compared with outcomes.
2. What does p=0.70 mean?
Show the explanation
p×100%=70%. It is a probability estimate, not a promise about the next event or a profit measure.