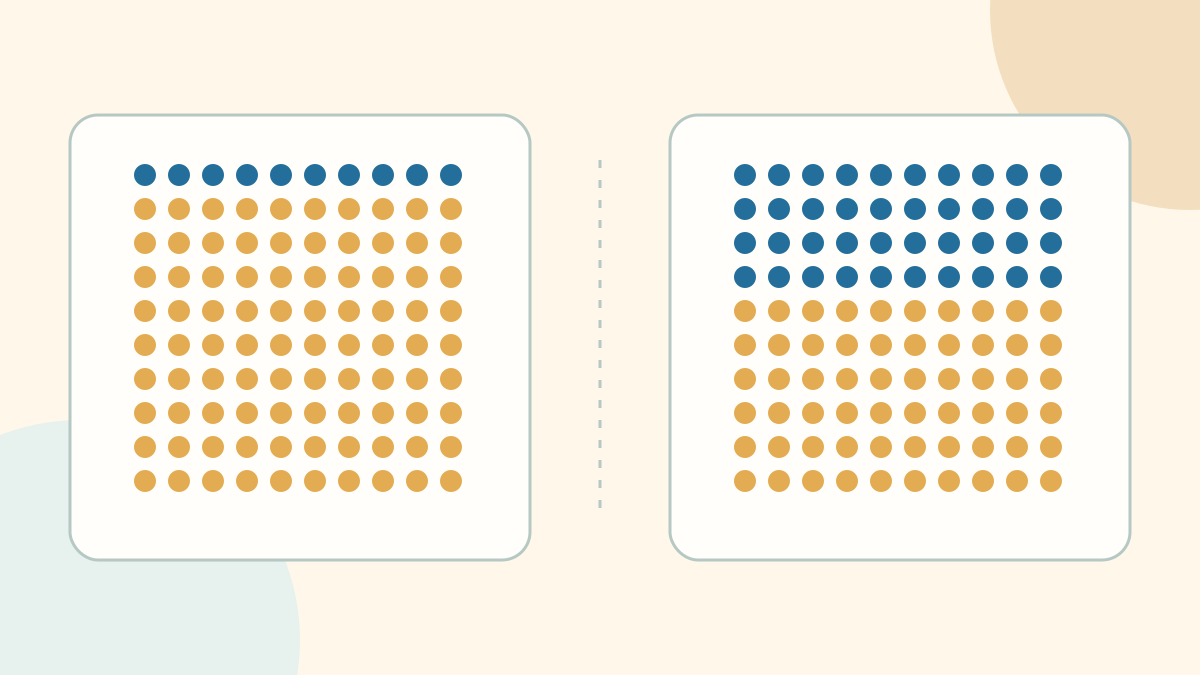
‘Group A makes up 10% of the population but 40% of prisoners.’ These percentages can both be correct, but do they have the same denominator? No: the first concerns the whole population, the second only the set of prisoners. Reading 40% as ‘40% of group A is imprisoned’ would change the statement completely.

We will translate words into fractions, reconstruct a table and distinguish four questions: how many there are, what share they represent, what the within-group rate is, and what the rate ratio is. Groups A and B and every number used here form a hypothetical teaching example, not data about real populations.
Open the percentages laboratory: examples, charts and worked steps
1. First question: what is the total?
Define P as the total population and C as the total number of prisoners. Groups A and B are disjoint and together cover all of P. The number a denotes A’s percentage share of the population; b denotes A’s percentage share of prisoners. Thus a = 10 means a% = 10%, not 0.10%.
The within-A rate is the number of prisoners from A divided by A’s entire population. To express it as a percentage, explicitly multiply by 100%. Changing the set in the denominator changes the question, not just the notation.
| Statement | Numerator | Denominator | Result |
|---|---|---|---|
| Population share | P_A | P | 10000/100000 × 100% = 10% |
| Share among prisoners | C_A | C | 400/1000 × 100% = 40% |
| Within-group rate A | C_A | P_A | 400/10000 × 100% = 4% |
2. From percentages to counts: the A and B table
Take P = 100000, C = 1000, a = 10 and b = 40. A contains 10000 people and B contains 90000. Of the 1000 prisoners, 400 belong to A and 600 to B.
B has more prisoners in absolute terms, but it also has a much larger population. To compare rates, divide each count by its own group’s population. The table places theory and example side by side without interchanging the two bases.
| Measure | Theory A | Example A | Theory B | Example B |
|---|---|---|---|---|
| Population share | a% | 10% | (100 − a)% | 90% |
| Share among prisoners | b% | 40% | (100 − b)% | 60% |
| Group population | P × a/100 | 10000 | P × (100 − a)/100 | 90000 |
| Prisoners in the group | C × b/100 | 400 | C × (100 − b)/100 | 600 |
| Within-group rate | (C_A/P_A) × 100% | (400/10000) × 100% = 4% | (C_B/P_B) × 100% | (600/90000) × 100% ≈ 0.667% |
| Ratio R = T_A/T_B | T_A/T_B | 4% / (2/3)% = 6 | [b × (100 − a)]/[a × (100 − b)] | (40 × 90)/(10 × 60) = 6 |
3. The rate-ratio formula
Write the two rates separately, then divide them. Both C/P and the factor 100% cancel in the ratio: R is therefore dimensionless, not a percentage.
This formula assumes P > 0, C > 0, 0 < a < 100 and 0 ≤ b < 100. If b = 100, B’s rate is zero and the ratio with A’s positive rate is not finite. If C = 0, both rates are zero and R is undefined. If a is 0 or 100, one group has no population and its rate cannot be defined.
T_A = [(C × b/100)/(P × a/100)] × 100%
    = (C/P) × (b/a) × 100%

T_B = [(C × (100 − b)/100)/(P × (100 − a)/100)] × 100%
    = (C/P) × [(100 − b)/(100 − a)] × 100%
R = T_A/T_B = [b × (100 − a)]/[a × (100 − b)]
R = [40 × (100 − 10)]/[10 × (100 − 40)]
  = (40 × 90)/(10 × 60) = 6
4. Why 6, 2/3 and 4 answer different questions
R = 6 says that A’s rate in this example is six times B’s. By contrast, 2/3 compares the counts 400 and 600 without adjusting for the different populations. Finally, b/a = 4 compares A’s share of prisoners with its share of the population: it does not directly compare A’s rate with B’s.
Six times a value means 600% of that value, or 500% higher: (6 − 1) × 100% = 500%. ‘Six times’ does not mean ‘600% higher’. Also, 40% − 10% = 30 percentage points is a difference between shares, not between the within-group rates.
A useful check is the weighted average: the overall population’s rate is the average of the two group rates weighted by group size. We cannot take the simple mean of 4% and approximately 0.667%, because the groups are not equally sized.
| Comparison | Calculation | Meaning |
|---|---|---|
| Rate ratio | 4% / (2/3)% = 6 | A’s rate relative to B’s rate |
| Count ratio | 400/600 = 2/3 | A’s prisoners relative to B’s prisoners |
| Representation index | 40/10 = 4 | A’s share among prisoners relative to its population share |
T = (a/100) × T_A + ((100 − a)/100) × T_B
  = (10/100) × 4% + (90/100) × (2/3)% = 1%
(C/P) × 100% = (1000/100000) × 100% = 1%
5. Comparing equally sized groups
In the main example, the rates correspond to 40 prisoners per 1000 people in A and approximately 6.667 per 1000 in B. The latter is a normalized frequency, not a fraction of a person in an actual count.
To visualize only R = 6, we can also imagine two groups of 1000 people containing 6 and 1 prisoners respectively. The rates become 0.6% and 0.1%, still with a ratio of 6. This new example preserves the ratio but NOT the first example’s rates of 4% and approximately 0.667%.
6. More examples: what changes and what stays the same
In the table, a and b are percentage shares; in the formula we use the numbers preceding %. If b = a, the rates are equal; if b > a, A’s rate is higher than B’s; if b < a, it is lower, in the nondegenerate cases described above.
Knowing only a and b is enough for R, but not for the individual rates: C/P is missing. If we double C while keeping P, a and b unchanged, both rates double but their ratio stays the same. You can observe this in the laboratory too.
The figures must be possible: A cannot have more prisoners than people, and neither can B. For example, P = 100, C = 50, a = 10 and b = 40 would imply 20 prisoners in a group of 10 people: incompatible data.
| a (%) | b (%) | Substitution | R |
|---|---|---|---|
| 10% | 40% | (40 × 90)/(10 × 60) | 6 |
| 20% | 40% | (40 × 80)/(20 × 60) | 2.667 |
| 10% | 10% | (10 × 90)/(10 × 90) | 1 |
| 30% | 15% | (15 × 70)/(30 × 85) | 0.412 |
7. Read the data without claiming more than they show
A rate ratio describes a difference observed in the example; alone it does not explain its causes or justify conclusions about individuals. In particular, prisoner data are not automatically the same as crime rates, convictions or prison admissions during a year.
Before calculating, check that the source, period, territory, event definition and categories are comparable. Distinguish people present at a given time from events over an interval; do not add overlapping groups. Age composition and other factors may also alter the comparison.
If the published percentages are rounded, R is an estimate too. Actual counts require consistent integers; decimal quantities produced by arbitrary percentages are theoretical values, not fractional people.
- Underline ‘relative to’, ‘among’, ‘of the group’ and ‘higher’: they identify the base or comparison.
- Write the numerator and denominator before inserting the figures.
- Distinguish a group’s share within a set from the event rate within the group.
- Compare rates only after normalizing by their respective populations.
- Check count compatibility, rounding and the limits of interpretation.
8. The same method for percentage changes
For changes, the denominator question is the same: compare the difference with the initial value, not the final one. The laboratory lets you find the change, the final value or the initial value using inverse formulas.
With successive changes, the second calculation uses the already modified value as its base. A +20% followed by −20% takes 100 to 120 and then to 96: it does not return to 100. After −20%, a +25% change is needed to return to the initial value. The dedicated sections show factors, every step and the final check.
In the change formulas, V is the initial value, N the final value and P the signed percentage-change number; p and q are two successive changes and r the return change. Here P does not denote the total population from the group problem.
P% = (N − V)/V × 100%
N = V × (100 + P)/100
V = 100 × N/(100 + P)

N = V × (1 + p/100) × (1 + q/100)
r = −100p/(100 + p)
Related articles
- From a fraction to a percentage
- Successive percentage changes
- Percentages: changes, inverse formulas and returning to the initial value
Open the percentages laboratory: examples, charts and worked steps
9. Try first, then reveal the solution
For each question, first write the ratio you intend to calculate. Solutions stay hidden until clicked.
If a = 20 and b = 40, is the rate ratio 2?
Show solution and explanation
No. R = (40 × 80)/(20 × 60) = 8/3 ≈ 2.667. The ratio 40/20 = 2 compares the share among prisoners with the population share, not the rates of A and B.
If a = 30 and b = 15, which group has the higher rate?
Show solution and explanation
R = (15 × 70)/(30 × 85) = 7/17 ≈ 0.412. A’s rate is approximately 41.176% of B’s; B’s rate is 17/7 ≈ 2.429 times A’s.
With P = 100000, a = 10 and b = 40, what happens when C increases from 1000 to 2000?
Show solution and explanation
A’s rate rises from 4% to 8% and B’s from approximately 0.667% to approximately 1.333%. R stays at 6: the C/P factor changes both rates in the same way.
A percentage cannot be understood from the number alone: you need the quantity being compared, the reference total and the question being answered.